why vaibhav sooryavanshi is better than your favorite ipl team
preface
Anybody who’s watched an Indian Premier League (IPL) game in the last three years will definitely (tearfully) tell you the story of how their team made 250 runs and still lost. The introduction of the Impact Player rule in 2023 allowed any team to substitute one player essentially whenever they saw fit. In effect, it handed every captain an extra batsman and an extra bowler. It meant you could save your strike pacer, aim for the big shots, run harder on the singles, and in the process, probably run your non-striker out too.
Vaibhav Sooryavanshi, the kid sensation from Bihar who hit a 35-ball century for Rajasthan, personifies this new regime of the IPL. The Impact Player rule has led to some of the highest scores ever seen in the tournament’s history, combined with record-breaking chases and skyrocketing 6s.
But why? What specifically makes this rule so potent in changing the face of the game? Why is Vaibhav Sooryavanshi better than your favorite team?
run rate
The most basic metric of higher scores is run rate: the number of runs scored per over. As even the most casual fan will tell you, the IPL has recently seen a big rise in scores, so clearly, there’d be a parallel rise in run rate.
What’s more interesting is if this change is uniform, i.e., are batsmen scoring more throughout the game?
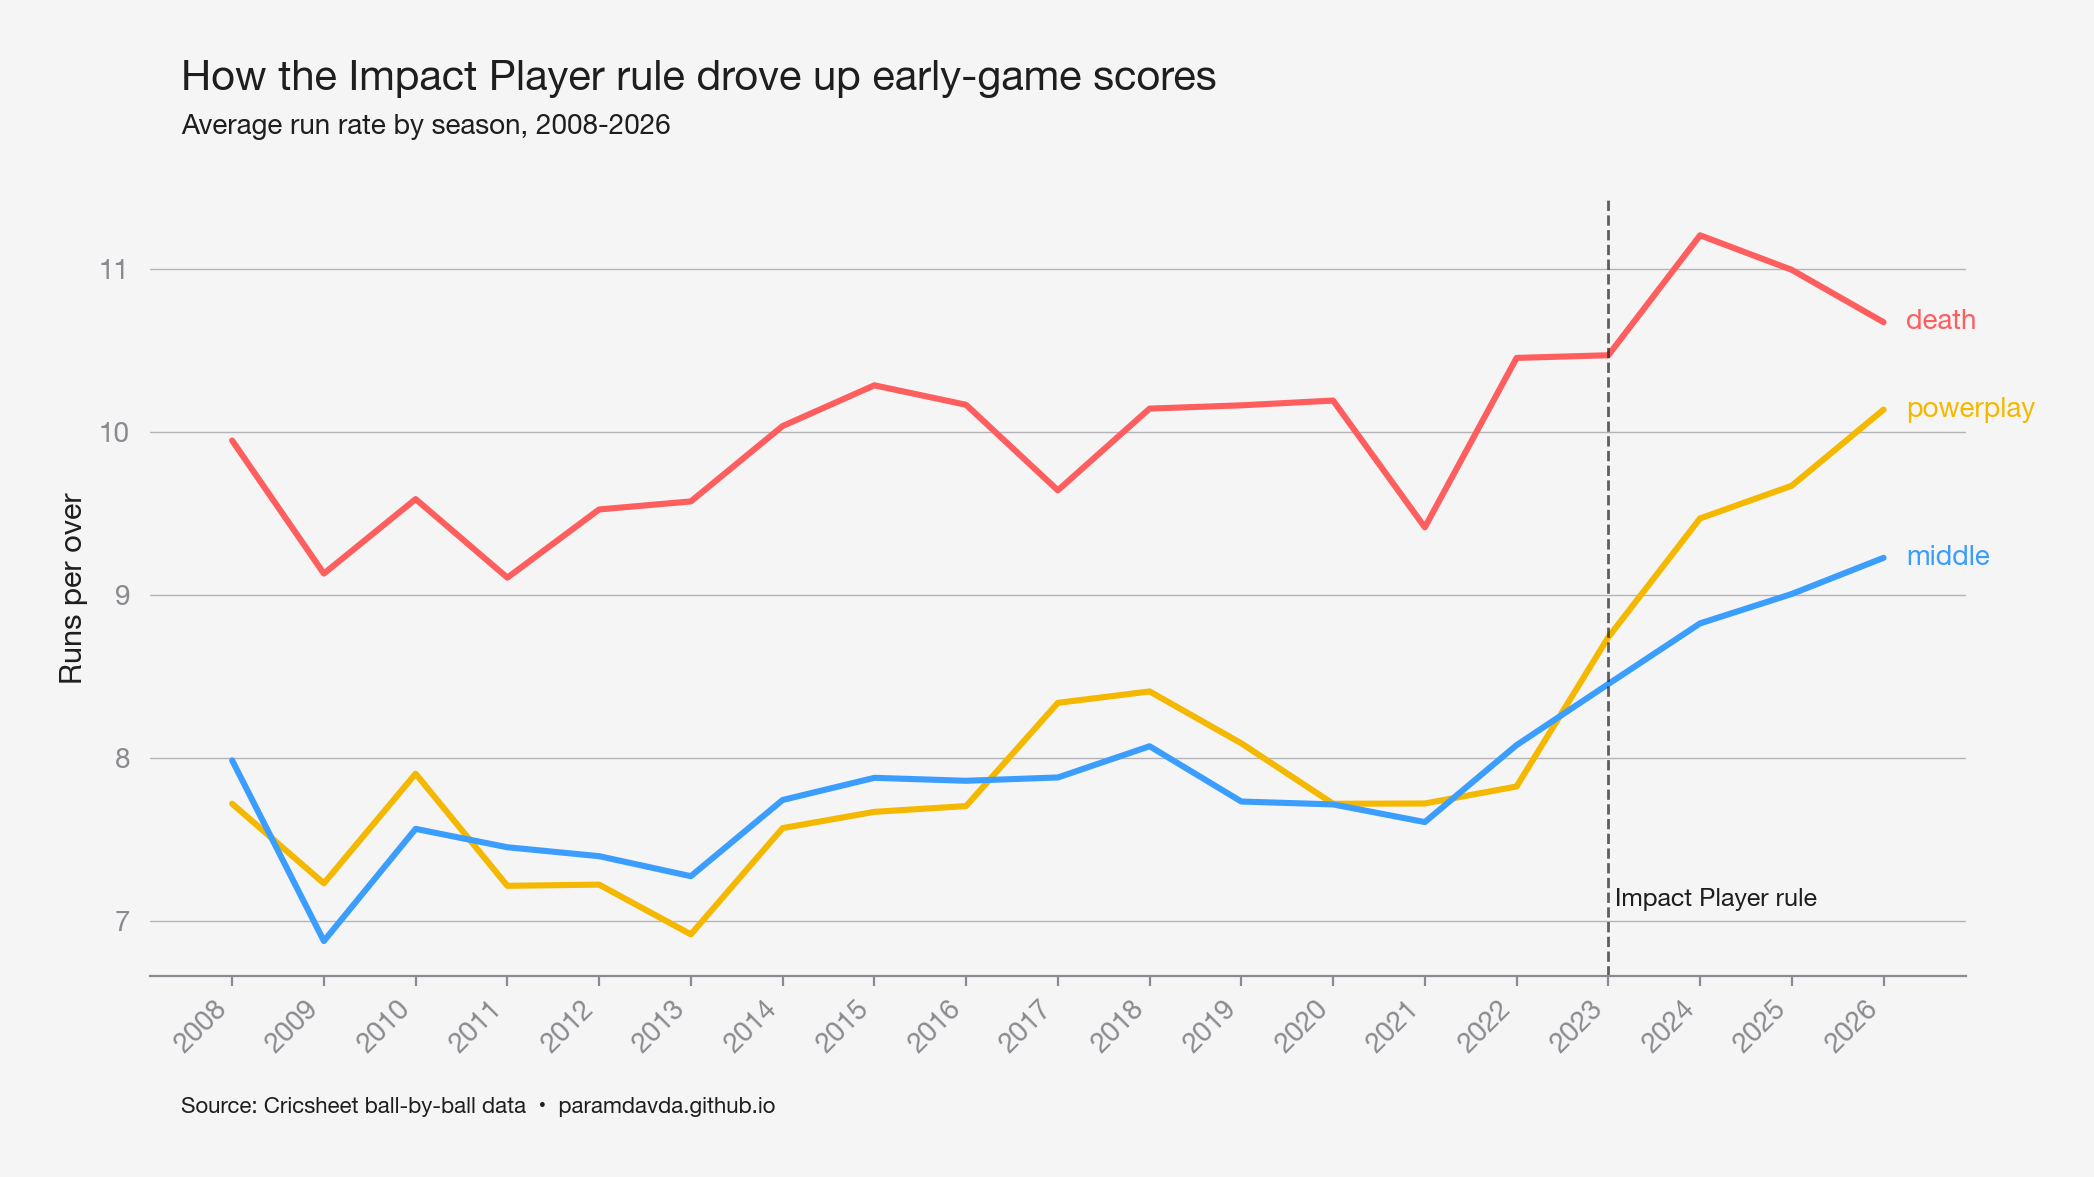
Not exactly. In fact, the powerplay and middle overs have seen a massive jump in scoring, while death overs rise modestly. This asymmetry indicates convergence: what used to be mad boundary-hitting towards the end of a game is now the norm.
Concretely, there’s a ~30% rise (7.8 $\rightarrow$ 10.2) from 2022-2026 in powerplay run rate. What most people would expect (as I did) was that there’d be a significant jump even in the death overs. But it appears that the death over run rate is capped, likely around ~11.5. Put less gently, the IPL is in a new regime. Rather than sustained aggression throughout an innings, the league rewards an explosive opening. But what does this cost the team? Less than you’d think.
wicket rate
For most of cricket (and IPL) history, always trying to swing for the boundary came with big risks. Unless you were Chris Gayle, you’d probably get out. So the uptick in scoring should logically also bring an uptick in wickets.
To check if this remains the case, let’s look at balls per wicket, i.e., how many balls, on average, does it take to get a batsman out? Remember, fewer balls per wicket mean wickets are falling more often.
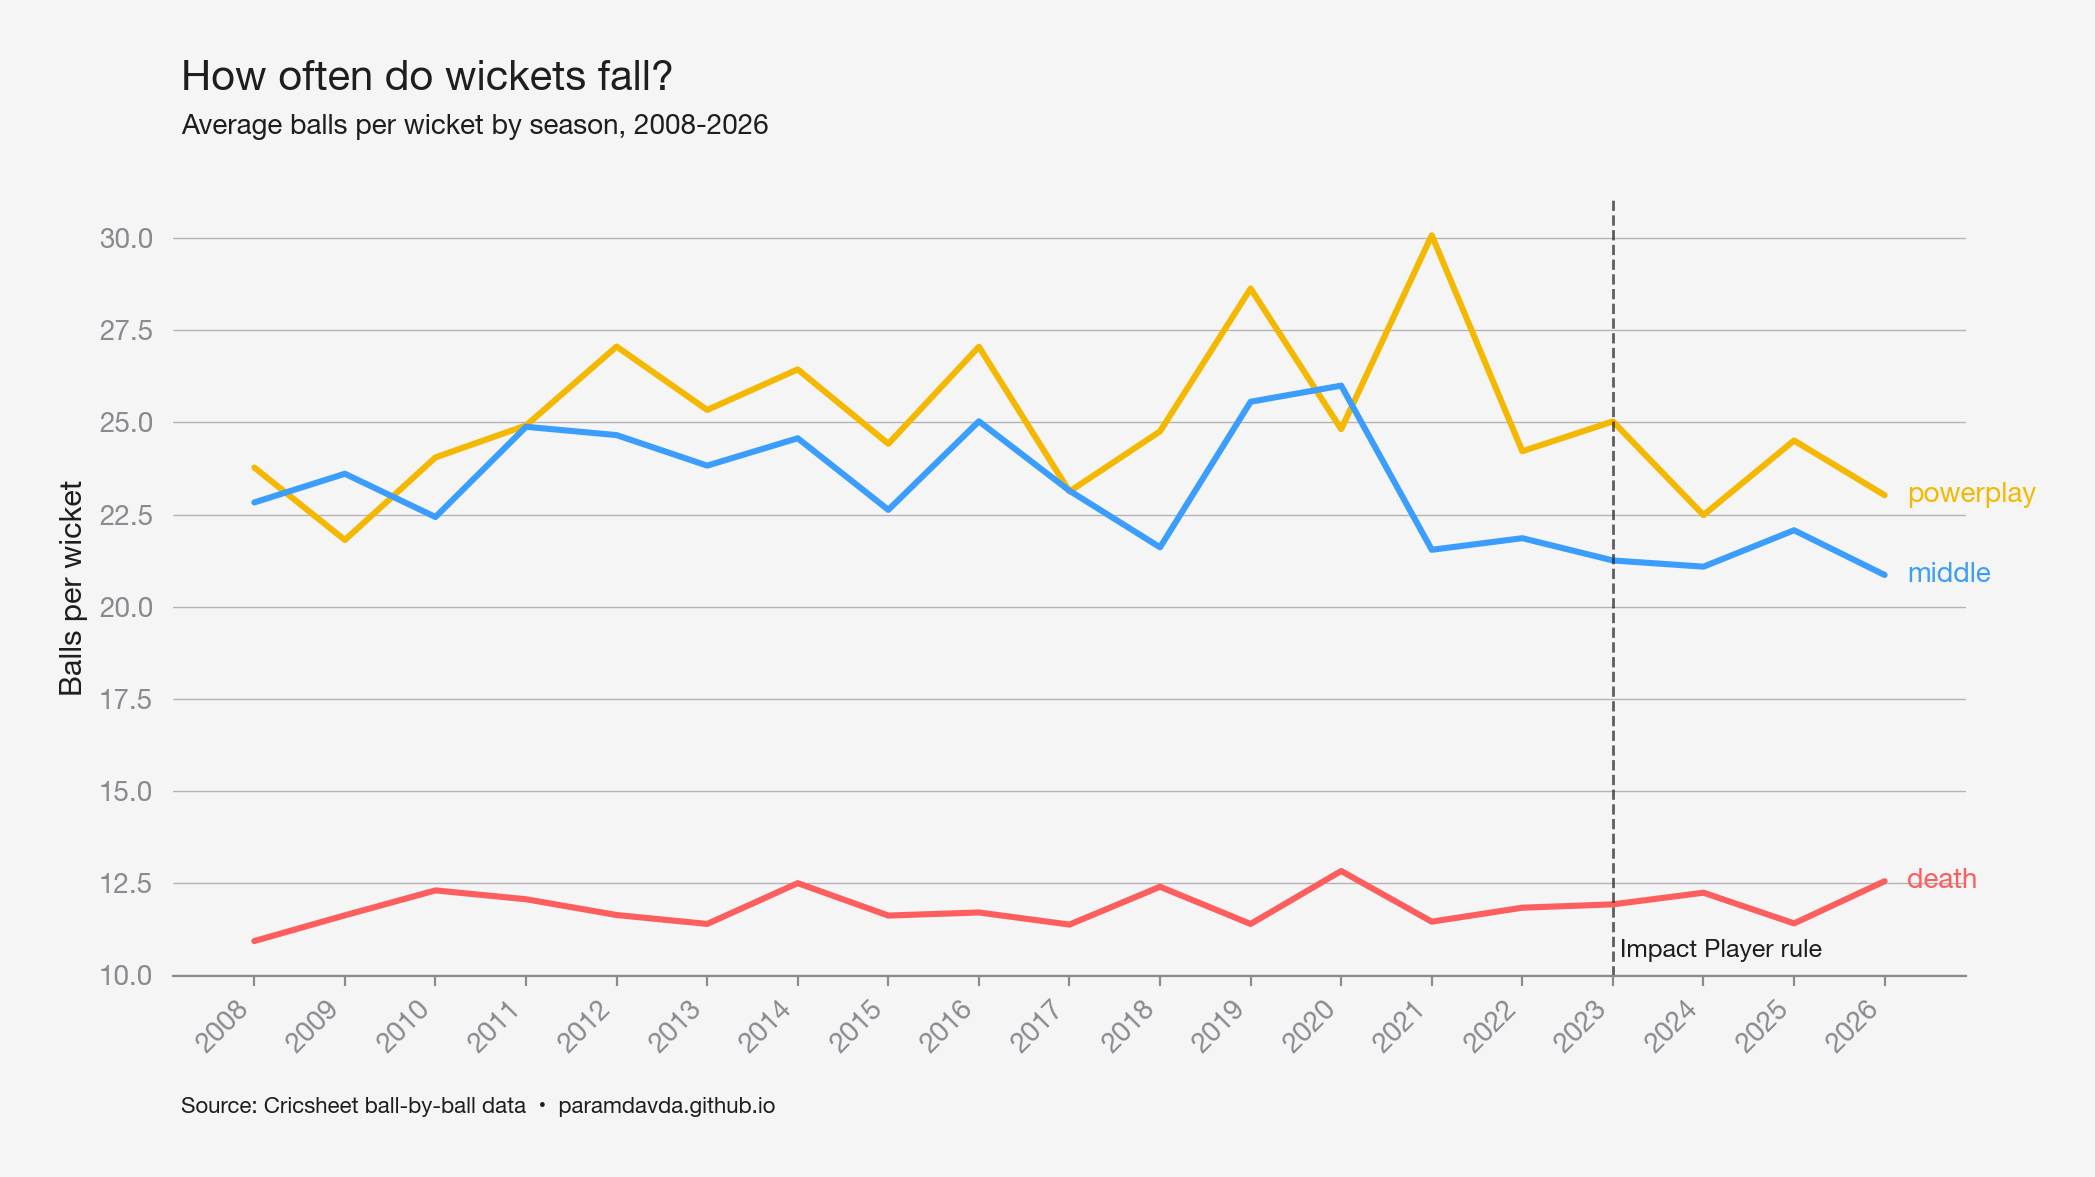
At first glance, this chart seems to validate our initial assumptions. It looks like powerplay and middle are seeing wickets fall more often than before, while death is mostly stagnant, matching up exactly with the pattern in run rate. But notice that the powerplay’s wicket rate is historically noisy (spiking circa 2021) so it’s more likely that this dip is a reversion to the baseline mean. At the same time, the middle shows a steady but clear fall from its baseline.
Lots of hand-waving, not so many numbers, so don’t take my word for it yet.
stdev shift
Most people have probably heard of z-scores as a way of comparing how far a particular value is compared to what we’d expect from the mean and standard deviation. To get a baseline feel for how 2023 affected the wicket rate, we’d need to do something similar: check how the post-2023 mean differs from the pre-2023 mean. Along the way, we also normalize by standard deviation because absolute shifts don’t mean much without context on how noisy the data originally was. And the results immediately tell a different story.
| Phase | Pre-2023 Mean | Post-2023 Mean | StDev Shift |
|---|---|---|---|
| Powerplay | 25.37 | 23.76 | -0.75 |
| Middle | 23.61 | 21.32 | -1.57 |
| Death | 11.79 | 12.02 | 0.44 |
While both powerplay and middle overs saw fewer balls per wicket, the drop for the middle overs was more than twice as large. So, wickets became increasingly likely to fall in the middle overs as compared to the powerplay. Basically, your middle-order batsman is way more likely to get out than your opener.
t-test
For the more statistical reader, the standard deviation shift is a pretty big oversimplification. We basically collapsed four seasons into a single mean. To reduce the hand-waviness, I also ran a t-test to check if the changes in mean really were statistically significant. Putting this next to the old findings, and…
| Phase | Pre-2023 Mean | Post-2023 Mean | StDev Shift | p-values |
|---|---|---|---|---|
| Powerplay | 25.37 | 23.76 | -0.75 | 0.0818 |
| Middle | 23.61 | 21.32 | -1.57 | 0.0002 |
| Death | 11.79 | 12.02 | 0.44 | 0.4516 |
…confirmed. As the p-value indicates, the drop in the middle overs was highly statistically significant (p<0.05) while the powerplay and death, not so much. Why does this matter? Well the top-line finding here is that after the introduction of Impact Players, wickets fell much more often in the middle overs, and while they were slightly more common in the powerplay, it wasn’t nearly as significant. More on this in a second.
the price of a wicket
We’re finally ready to talk about the most important change that the Impact Player rule made to the game, as well as the core hypothesis that got you here. Fundamentally, the post-2023 regime made an individual wicket matter much less. But this increase in aggression didn’t punish every phase equally, and so, the asymmetry opened a wide gap. For example, we found a near 30% increase in powerplay run rate, but no corresponding higher risk of wickets.
So, the powerplay became a market inefficiency, an opportunity for the batting side to take more risks and swing harder without paying the difference in wickets. In other words, it was a free lunch.
This is most obvious when we compare it to the middle overs, which also saw a higher run rate, but paid the difference with a lower number of balls per wicket. Batsmen still took risks, but were punished for it. This is bought aggression. The market regulates the increase in runs with a corresponding increase in wicket opportunities.
One of the best ways to visualize the difference is by comparing the actual price of a wicket, in runs.
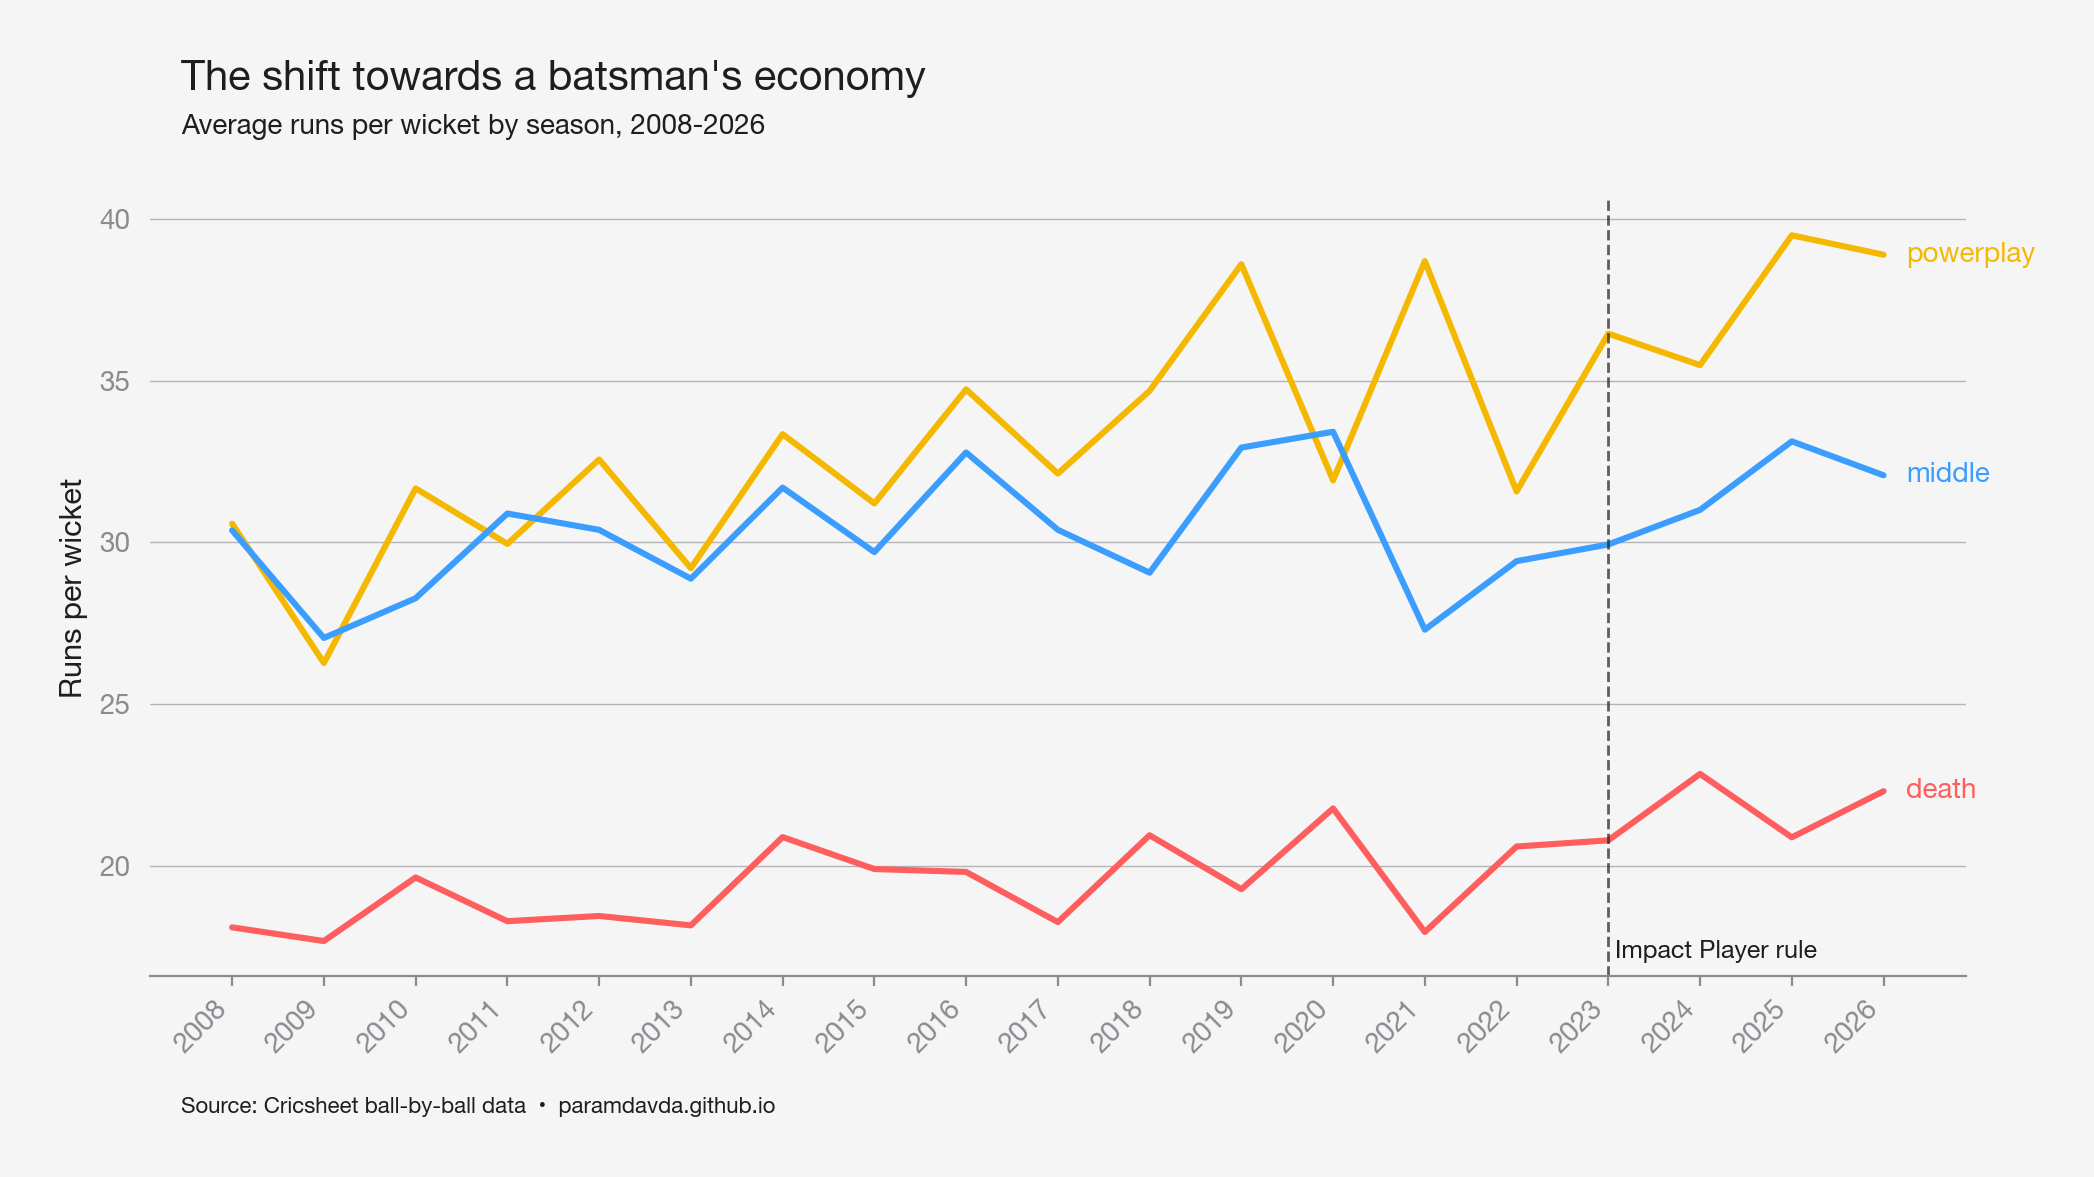
Much clearer payoff. Concretely, the introduction of the Impact Player rule drove a wedge between runs per wicket in the powerplay vs the middle overs. It’s why the Vaibhav Sooryavanshis of the world could open the innings with a barrage of sixes and not get out immediately. Simultaneously, the death overs show a slight uptick, but per the tests above (p=0.45), it’s almost impossible to distinguish this from statistical noise.
sanity check (pelt)
But how do we know this change was concentrated in 2023? After all, leagues around the world are seeing high-scoring, exciting games. What if this risk-reward ‘free lunch’ structure was inevitable, a function of the broader trend towards aggression (Bazball, anyone?) rather than an Impact-Player-specific phenomenon?
To justify this claim, we can run a formal changepoint test: a statistical method that looks at the data, with no context of what an Impact Player is, and tries to identify where it splits. Specifically, our technique, called Pruned Exact Linear Time (PELT) iterates through the time series, deciding to mark changepoints based on if doing so would minimize a set cost function and penalty.
When we run PELT on powerplay and middle over data for run rate and balls per wicket, the results are clear. For run rate, the algorithm identifies exactly one changepoint for both powerplay and middle: 2023. For balls per wicket, the algorithm finds no changepoint in the powerplay and once again, spits out 2023 for the middle.
This is the core idea, in two lines. Run rate obviously underwent a structural shift in 2023, but the corresponding wicket rate lagged behind, especially in the powerplay. This meant powerplays became a free lunch: swing big, but keep your wicket.
limitations
The analysis, like any, is a (great, I’d hope) approximation of this fundamental inefficiency. But it’s far from perfect.
Running any statistical test with few datapoints is always difficult. Specifically, there’s only about 4 seasons of data after the introduction of Impact Players, which means that there’s no guarantee that a trend like this continues. Using Welch’s t-test rather than the standard and adding the standard deviation split as a confirmatory check helps, but the limitation still holds.
Venue changes are a fundamental problem when 2.5ish seasons weren’t played at home (2009, 2020, and about half of 2021). These are confounding factors, and might have influenced some of these trends.
As every skeptic of the game will tell you, pitches are flatter, a change that favors the batsman. This is another confounding factor.
Most important, this analysis identifies a structural shift in 2023, but can’t prove its cause. Without more sophisticated analysis, it’s impossible to definitively say that the Impact Player rule was the only reason for our findings.
what’s next?
Finding a regime change is interesting, but it leaves a lot to be desired. Yes, powerplays are a free lunch, and yes, Vaibhav Sooryavanshi is great, but what do we do about that? It’s worth asking what archetype of player this new regime favors, and which teams’ rosters are best-equipped to handle it. So that’s what we’ll ask.